Energy Saving and Temperature-Field Stabilization for Cathode Material Calcination Kilns
Application Scenario
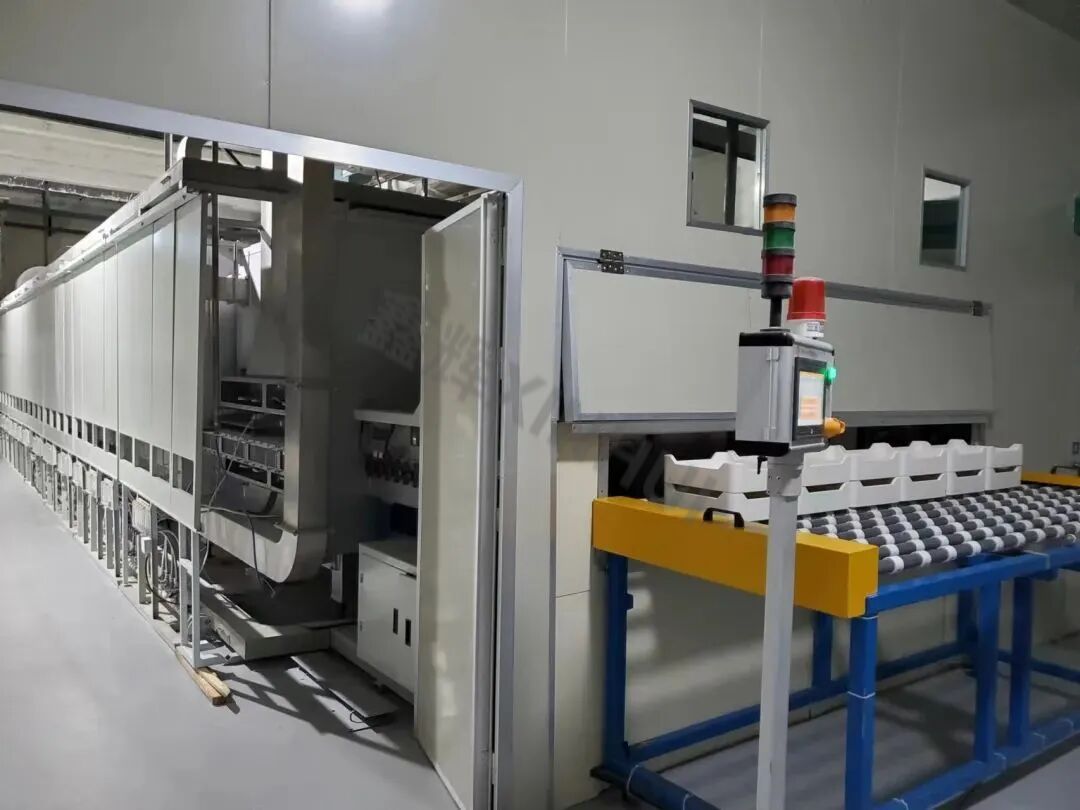
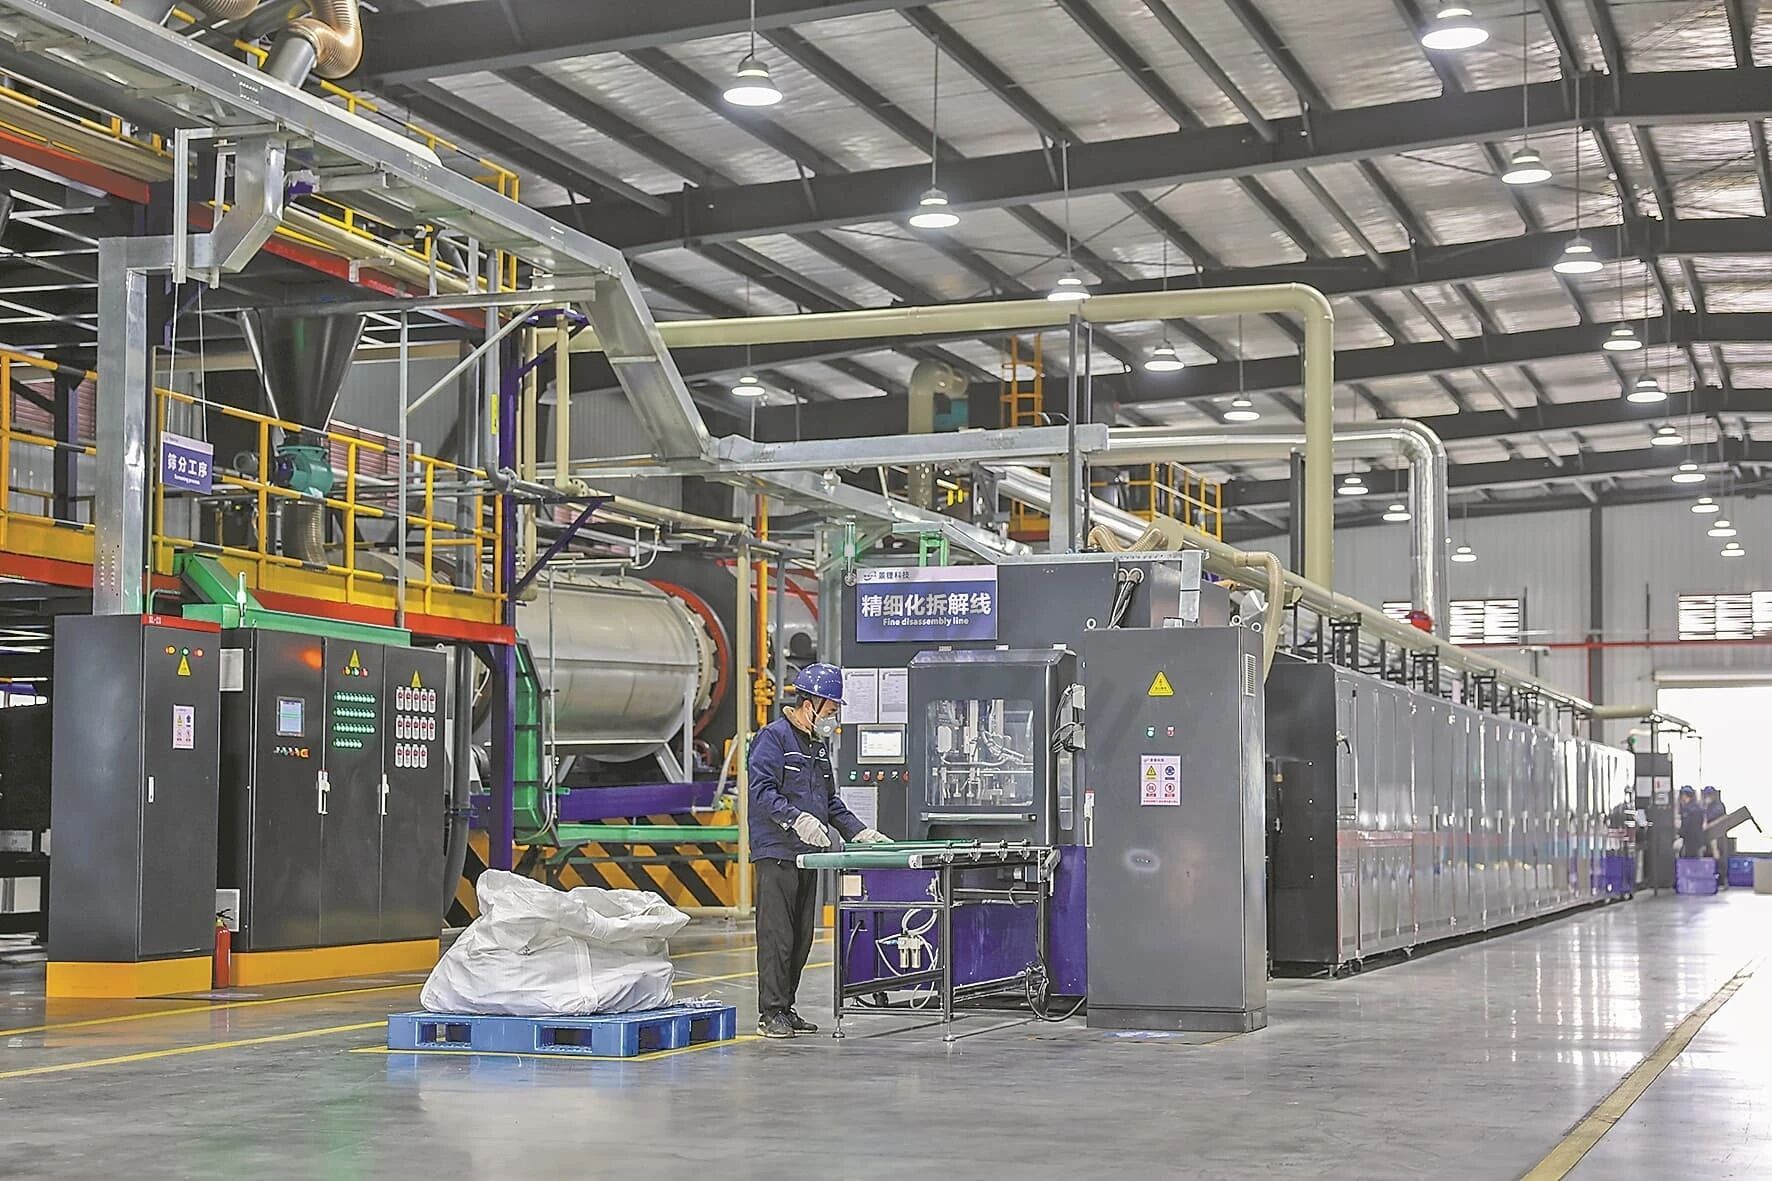
These kilns serve the EV supply chain for calcination/sintering of lithium battery cathode materials. Typical service temperatures are around 700-900 deg C, sometimes covering 700-1100 deg C, or running long-term in the 800-1000 deg C range (driven by material system, precursor route, soak time, and atmosphere window).
Continuous lines focus on two things: long-term stability of temperature and atmosphere, and controlled energy use and fluctuation.
Common On-site Issues
- Shell temperature rise is high, with hot spots fixed at kiln mouths, door zones, access ports, and interface flanges, causing long-term leakage.
- Lining thermal inertia is high; zone adjustments and start/stop recovery are slow, and temperature drift is more obvious.
- Under powder conditions, the hot face suffers scouring, build-up, or local erosion, increasing repair frequency and indirectly driving temperature-field and energy fluctuations.
Implementation Approach
The plan centers on "hot-face duty + backup heat-loss reduction + thermal bridge cleanup."
Hot-face erosion-resistant layer
Dense brick/castable systems carry load, resist scouring and corrosion, and keep the hot-face structure stable long-term, reducing looseness, spalling, and local collapse that disturb the temperature field.
Backup insulation layer
Lightweight mullite IFB as the main insulation to reduce conductivity and heat storage. In tight or complex areas, add fiber blankets/boards/modules to form a continuous insulation layer, reducing shell heat loss and temperature fluctuation.
Thermal bridge treatment at doors and interfaces
Door frames, kiln mouths, view/access ports, and gas interfaces/flanges get dedicated structural treatment: thermal breaks, continuous overlaps, multi-layer sealing. Hot spots stop recurring at the same locations, and shell temperature rise is easier to control.
On-site Iteration
Three data sets keep the work moving:
- Temperature curves: set vs actual per zone, overshoot and recovery time.
- Power/energy curves: segmented statistics for ramp, soak, and standby.
- Shell temperature points: door zone, interface zone, corners, shell mid (thermal imaging or spot measurement).
The action sequence is fixed: handle thermal bridges and sealing continuity first, then adjust backup layering and thickness, then standardize construction details and bake-out curve to reduce batch variation.
Changes After Implementation
- Shell hot spots shrink, shell temperature rise is more uniform, and local high-temperature zones at doors and interfaces are reduced.
- Smoother power compensation in soak; less mutual interference between zones and lower operating fluctuation.
- Faster start/stop and condition switching, shorter recovery time, and steadier continuous cadence.
- Fewer hot-face failures and repairs, lighter maintenance workload, higher line stability.